《量化投资:以MATLAB为工具》-基础篇-N分钟学会MATLAB(60<N<180)
Learn Matlab Using N minutes(60<N<180)
by LiYang
Email:farutoliyang@gmail.com
Last Updated 2013/08
Contents
- A Little Clean Work
- 能否简单举一个MATLAB的例子?
- 如何查看函数的代码?
- MATLAB里面可以使用科学计数法么?
- 如何恢复MATLAB的文件关联?
- MATLAB可以读Excel的数据?
- 如何删掉缺失值?
- 如何将字符串转变为命令执行?
- 如何向一个向量追加元素?
- 如何移除矩阵的某行(列)数据?
- 如何比较两个矩阵是否相同呢?
- 如何去掉数据中的重复元素?
- 如何求数据的极值?
- 如何求矩阵最大(小)值并返回其行列号?
- 如何从一组数据中随机抽取数据?
- 如何将数据标准化?
- 如何计算积分?
- MATLAB如何进行复数计算?
- 如何生成对角矩阵?
- 如何构造上(下)三角矩阵?
- MATLAB常用的运算符号有哪些?
- 如何求矩阵各行(列)的均值?
- 如何计算组合数或得到所有组合?
- 如何在MATLAB里面求(偏)导数?
- 如何求一元方程的根?
- 如何在字符串中选取特定位置的字符?
- 如何返回字符个数?
- 日期可以做算术运算么?
- 如何将日期表示为“07-Aug- 2013”这种格式?
- 如何在同一画面画出多张图?
- 怎么做饼图?
- MATLAB如何做双坐标?
- 如果绘图时标题太长,如何换行?
- 如何用不同的颜色来代表数据?
- 如何调整所绘图形的大小?
- 如何绘制椭圆或双曲线?
- 在MATLAB中如何绘制K线图?
- 如何做线性回归模型?
- 如何做主成分分析?
- 多项式回归应该用什么函数?
- 如何做聚类分析?
- 如何利用MATLAB获取免费的金融数据?
- 在MATLAB中如何处理地图数据?
- 如何计算一个资金流的最大回撤?
- Test
- Record Time
A Little Clean Work
tic;
clear;
clc;
close all;
format compact;
能否简单举一个MATLAB的例子?
Mean_Value = 0;
STD_Value = 1;
Data_Num = 100;

x = random('Normal', Mean_Value, STD_Value, Data_Num, 1);
x_dataset = dataset(x);

whos
mean_x = mean(x)
std_x = std(x)
summary(x_dataset)
  Name              Size            Bytes  Class      Attributes

  Data_Num          1x1                 8  double
  Mean_Value        1x1                 8  double
  STD_Value         1x1                 8  double
  x               100x1               800  double
  x_dataset       100x1              1784  dataset

mean_x =
    0.1861
std_x =
    1.0350
x: [100x1 double]
    min        1st quartile    median     3rd quartile    max
    -2.2751    -0.51495        0.20808    0.90037         2.7304
如何查看函数的代码?
edit mean;
MATLAB里面可以使用科学计数法么?
format longG
1e10
1.2e-4

format short
ans =
               10000000000
ans =
                   0.00012
如何恢复MATLAB的文件关联?
cwd=pwd;
cd([matlabroot '\toolbox\matlab\winfun\private']);
fileassoc('add',{'.m','.mat','.fig','.p','.mdl',['.' mexext]});%重点
cd(cwd);
disp('Changed Windows file associations. FIG, M, MAT, MDL, MEX, andP files are now associated with MATLAB.')
Changed Windows file associations. FIG, M, MAT, MDL, MEX, andP files are now associated with MATLAB.
MATLAB可以读Excel的数据?
values = {1, 2, 3 ; 4, 5, 'x' ; 7, 8, 9};
headers = {'First', 'Second', 'Third'};
xlswrite('eg_Mat2Excel.xlsx', [headers; values]);

A = xlsread('eg_Mat2Excel.xlsx')
A =
     1     2     3
     4     5   NaN
     7     8     9
如何删掉缺失值?
A = [1 NaN 3]

A( isnan(A) ) = []
A =
     1   NaN     3
A =
     1     3
如何将字符串转变为命令执行?
A = 3;
B = 5;

string = [num2str(A),'+',num2str(B)]

eval(string);
string =
3+5
ans =
     8
如何向一个向量追加元素?
A = [1 2 3 4]

A(end+1) = 5
A =
     1     2     3     4
A =
     1     2     3     4     5
如何移除矩阵的某行(列)数据?
A = magic(5)
B = A;
C = A;

B(5,:) = []
C(:,5) = []
A =
    17    24     1     8    15
    23     5     7    14    16
     4     6    13    20    22
    10    12    19    21     3
    11    18    25     2     9
B =
    17    24     1     8    15
    23     5     7    14    16
     4     6    13    20    22
    10    12    19    21     3
C =
    17    24     1     8
    23     5     7    14
     4     6    13    20
    10    12    19    21
    11    18    25     2
如何比较两个矩阵是否相同呢?
A = magic(5)
B = A;

B(1) = 888

whetherAequalsB = all( all( A == B ) )
A =
    17    24     1     8    15
    23     5     7    14    16
     4     6    13    20    22
    10    12    19    21     3
    11    18    25     2     9
B =
   888    24     1     8    15
    23     5     7    14    16
     4     6    13    20    22
    10    12    19    21     3
    11    18    25     2     9
whetherAequalsB =
     0
如何去掉数据中的重复元素?
A = [1 1 2 2 3 4 5 6 6]

A_unique = unique(A)
A =
     1     1     2     2     3     4     5     6     6
A_unique =
     1     2     3     4     5     6
如何求数据的极值?
A = 1:10

A_min = min(A)

A_max = max(A)
A =
     1     2     3     4     5     6     7     8     9    10
A_min =
     1
A_max =
    10
如何求矩阵最大(小)值并返回其行列号?
% 方法1
disp('方法1');
A=[0 17 50;-12 40 3;5 -10 2;30 4 3]
[C,I]=max(A(:))
[m,n]=ind2sub(size(A),I)
% 方法2
disp('方法2');
A=[0 17 50;-12 40 3;5 -10 2;30 4 3]
[M,I]=max(A)
[N,J]=max(M)
[I(J),J]
% 方法3
disp('方法3');
A=[0 17 50;-12 40 3;5 -10 2;30 4 3]
N=max(max(A))    %或者N=max(A(:))
[r,c]=find(N==A)
% 方法4
disp('方法4');
A=[0 17 50;-12 40 3;5 -10 2;30 4 3]
[Y_col,Ind_row]=max(A)   %每列的最大值及行号
[Y_row,Ind_col]=max(A')    %每行的最大值及列号
方法1
A =
     0    17    50
   -12    40     3
     5   -10     2
    30     4     3
C =
    50
I =
     9
m =
     1
n =
     3
方法2
A =
     0    17    50
   -12    40     3
     5   -10     2
    30     4     3
M =
    30    40    50
I =
     4     2     1
N =
    50
J =
     3
ans =
     1     3
方法3
A =
     0    17    50
   -12    40     3
     5   -10     2
    30     4     3
N =
    50
r =
     1
c =
     3
方法4
A =
     0    17    50
   -12    40     3
     5   -10     2
    30     4     3
Y_col =
    30    40    50
Ind_row =
     4     2     1
Y_row =
    50    40     5    30
Ind_col =
     3     2     1     1
如何从一组数据中随机抽取数据?
out = randsrc(5,5,[-3 -1 1 3; .2 .3 .3 .2])
out =
    -1     1    -1     1     1
    -1     1     3     1    -1
     1    -3     1    -3     3
     3     3     3    -1     3
     3    -1    -1    -1    -1
如何将数据标准化?
x = [1 1 2 3 5 8 11]

Z = zscore(x)

Ztemp = ( x-mean(x) )./std(x)
x =
     1     1     2     3     5     8    11
Z =
   -0.8967   -0.8967   -0.6352   -0.3736    0.1495    0.9341    1.7187
Ztemp =
   -0.8967   -0.8967   -0.6352   -0.3736    0.1495    0.9341    1.7187
如何计算积分?
syms x
int(sin(x))

integral(@sin, 0,pi)
ans =
-cos(x)
ans =
    2.0000
MATLAB如何进行复数计算?
Z = complex(3,4)

% 实部
Z_real = real( Z )
% 虚部
Z_imag = imag( Z )
% 模
Z_abs = abs( Z )
% 辐角
Z_angle = angle( Z )
% 共轭
ZC = conj( Z )
Z =
   3.0000 + 4.0000i
Z_real =
     3
Z_imag =
     4
Z_abs =
     5
Z_angle =
    0.9273
ZC =
   3.0000 - 4.0000i
如何生成对角矩阵?
X = diag([1 1 2 3 5 8])

x = magic(5)

x_diag = diag(x)
X =
     1     0     0     0     0     0
     0     1     0     0     0     0
     0     0     2     0     0     0
     0     0     0     3     0     0
     0     0     0     0     5     0
     0     0     0     0     0     8
x =
    17    24     1     8    15
    23     5     7    14    16
     4     6    13    20    22
    10    12    19    21     3
    11    18    25     2     9
x_diag =
    17
     5
    13
    21
     9
如何构造上(下)三角矩阵?
tl = tril(ones(4,4),-1)

tu = triu(ones(4,4),-1)
tl =
     0     0     0     0
     1     0     0     0
     1     1     0     0
     1     1     1     0
tu =
     1     1     1     1
     1     1     1     1
     0     1     1     1
     0     0     1     1
MATLAB常用的运算符号有哪些?
a=magic(3)
b=pascal(3)

disp('a/b')
a/b
disp('a*inv(b)')
a*inv(b)

disp('a\b')
a\b
disp('inv(a)*b')
inv(a)*b

a/b-(b'\a')'

disp('a^3')
a^3
disp('a*a*a')
a*a*a

disp('a.*b')
a.*b
disp('a.\b')
a.\b
disp('a./b')
a./b
disp('a.^b')
a.^b
a =
     8     1     6
     3     5     7
     4     9     2
b =
     1     1     1
     1     2     3
     1     3     6
a/b
ans =
    27   -31    12
     1     2     0
   -13    29   -12
a*inv(b)
ans =
   27.0000  -31.0000   12.0000
    1.0000    2.0000    0.0000
  -13.0000   29.0000  -12.0000
a\b
ans =
    0.0667    0.0500    0.0972
    0.0667    0.3000    0.6389
    0.0667    0.0500   -0.0694
inv(a)*b
ans =
    0.0667    0.0500    0.0972
    0.0667    0.3000    0.6389
    0.0667    0.0500   -0.0694
ans =
     0     0     0
     0     0     0
     0     0     0
a^3
ans =
        1197        1029        1149
        1077        1125        1173
        1101        1221        1053
a*a*a
ans =
        1197        1029        1149
        1077        1125        1173
        1101        1221        1053
a.*b
ans =
     8     1     6
     3    10    21
     4    27    12
a.\b
ans =
    0.1250    1.0000    0.1667
    0.3333    0.4000    0.4286
    0.2500    0.3333    3.0000
a./b
ans =
    8.0000    1.0000    6.0000
    3.0000    2.5000    2.3333
    4.0000    3.0000    0.3333
a.^b
ans =
     8     1     6
     3    25   343
     4   729    64
如何求矩阵各行(列)的均值?
a = magic(4)
% 各行均值
a_rowmean = mean(a , 2)
% 各列均值
a_colmean = mean(a , 1)
a =
    16     2     3    13
     5    11    10     8
     9     7     6    12
     4    14    15     1
a_rowmean =
    8.5000
    8.5000
    8.5000
    8.5000
a_colmean =
    8.5000    8.5000    8.5000    8.5000
如何计算组合数或得到所有组合?
combnum = nchoosek(4, 2)

comb = nchoosek([1 2 3 4], 2)

fac = factorial(4)
combnum =
     6
comb =
     1     2
     1     3
     1     4
     2     3
     2     4
     3     4
fac =
    24
如何在MATLAB里面求(偏)导数?
syms x
dy_dx = diff( sin(x)/x )
dy_dx =
cos(x)/x - sin(x)/x^2
如何求一元方程的根?
syms x

s1 = solve( x^2-1 )

s2 = solve(x^2 + 4*x + 1 == 0)

s3 = solve(x^4 + 1 == 2*x^2 - 1)
s1 =
  1
 -1
s2 =
   3^(1/2) - 2
 - 3^(1/2) - 2
s3 =
  (1 + i)^(1/2)
  (1 - i)^(1/2)
 -(1 + i)^(1/2)
 -(1 - i)^(1/2)
如何在字符串中选取特定位置的字符?
str = 'abcdef'

substr1 = str( [2 4] )

substr2 = str( 1:3 )
str =
abcdef
substr1 =
bd
substr2 =
abc
如何返回字符个数?
str = 'abcdef'
strlen = length(str)
str =
abcdef
strlen =
     6
日期可以做算术运算么?
n1 = datenum( '01/08/2013', 'dd/mm/yyyy' )

n2 = datenum( '08/08/2013', 'dd/mm/yyyy' )

n3 = n1 + 2

d1 = datestr( n1, 'dd/mm/yyyy' )

d2 = datestr( n2, 'dd/mm/yyyy' )

d3 = datestr( n3, 'dd/mm/yyyy' )
n1 =
      735447
n2 =
      735454
n3 =
      735449
d1 =
01/08/2013
d2 =
08/08/2013
d3 =
03/08/2013
如何将日期表示为“07-Aug- 2013”这种格式?
d = datestr( datenum( '07/08/2013', 'dd/mm/yyyy' ), 'dd-mmm-yyyy' )
d =
07-Aug-2013
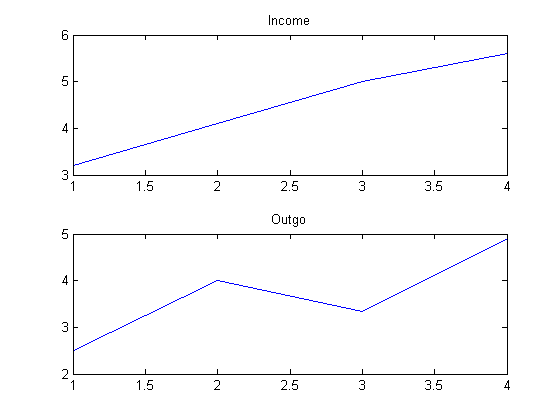
如何在同一画面画出多张图?
figure;
income = [3.2,4.1,5.0,5.6];
outgo = [2.5,4.0,3.35,4.9];

subplot(2,1,1);
plot(income);
title('Income');

subplot(2,1,2);
plot(outgo);
title('Outgo');
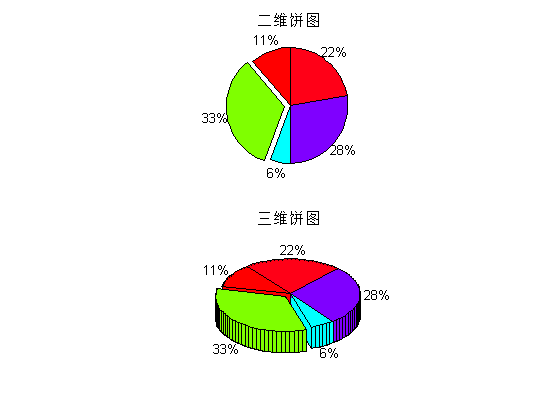
怎么做饼图?
x = [1 3 0.5 2.5 2];
explode = [0 1 0 0 0];

figure;
subplot(2,1,1);
pie(x,explode);
title('二维饼图');
colormap jet

subplot(2,1,2);
pie3(x,explode);
title('三维饼图');
colormap hsv
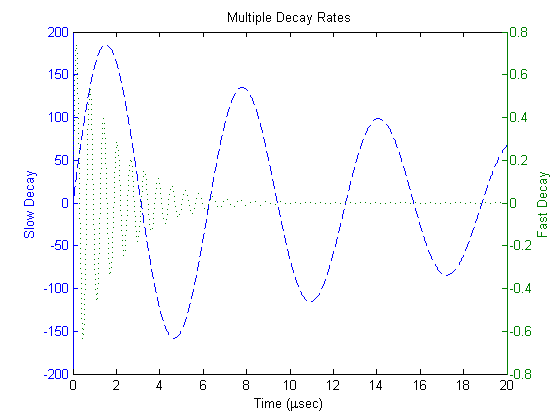
MATLAB如何做双坐标?
figure
x = 0:0.01:20;
y1 = 200*exp(-0.05*x).*sin(x);
y2 = 0.8*exp(-0.5*x).*sin(10*x);
[AX,H1,H2] = plotyy(x,y1,x,y2,'plot');

set(get(AX(1),'Ylabel'),'String','Slow Decay')
set(get(AX(2),'Ylabel'),'String','Fast Decay')
xlabel('Time (\musec)')
title('Multiple Decay Rates')
set(H1,'LineStyle','--')
set(H2,'LineStyle',':')
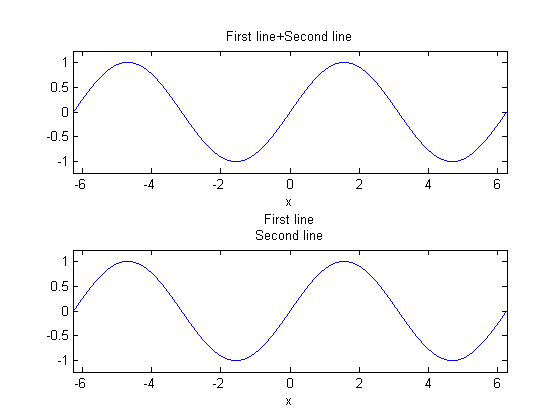
如果绘图时标题太长,如何换行?
figure
subplot(2,1,1);
ezplot( @sin );
title('First line+Second line');

subplot(2,1,2);
ezplot( @sin );
str = {'First line';'Second line'};
title( str );
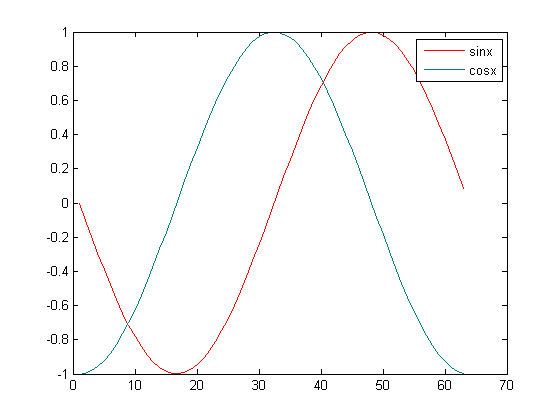
如何用不同的颜色来代表数据?
figure;
x = -pi:.1:pi;
y = sin(x);
z = cos(x);
RGB = [1 0 0];
plot( y, 'Color', RGB )
hold on;
RGB = [0 0.5 0.5];
plot( z, 'Color', RGB )
legend('sinx', 'cosx');
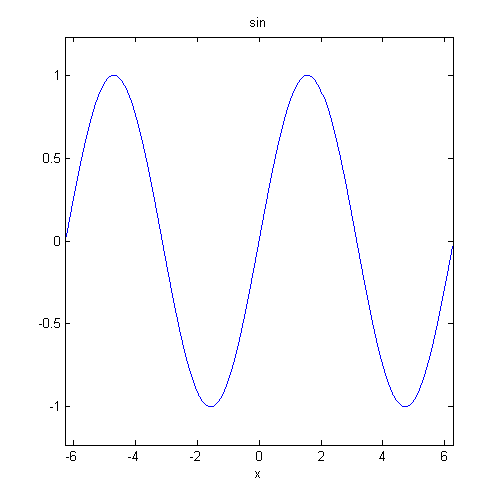
如何调整所绘图形的大小?
left = 100;
bottom = 100;
width = 500;
height = 500;
figure( 'Position', [left, bottom, width, height]);
ezplot(@sin)
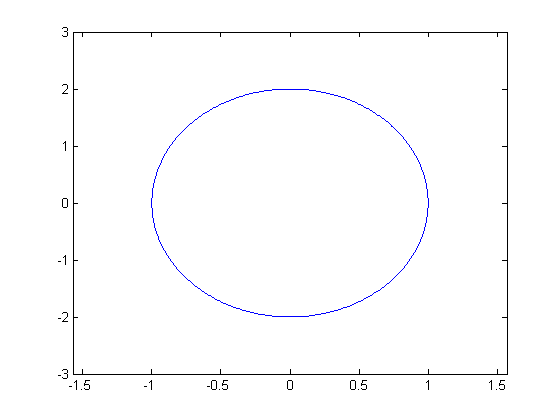
如何绘制椭圆或双曲线?
t = 0:0.01:2*pi;
a = 1;
b = 2;
x = a*sin(t);
y = b*cos(t);
figure;
plot(x,y);
xlim( [-pi/2, pi/2] );
ylim( [-3, 3] );
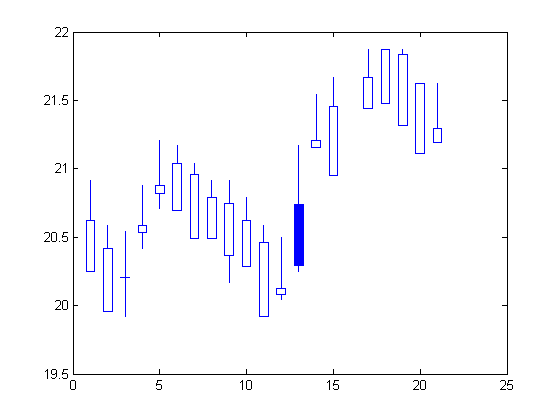
在MATLAB中如何绘制K线图?
load disney;
candle(dis_HIGH(end-20:end), dis_LOW(end-20:end), dis_CLOSE(end-20:end),...
        dis_OPEN(end-20:end), 'b');
如何做线性回归模型?
x1 = [.2 .5 .6 .8 1.0 1.1]';
x2 = [.1 .3 .4 .9 1.1 1.4]';

A = [ones(size(x1)) x1 x2]
b = [.17 .26 .28 .23 .27 .34]'

a1 = A\b

a2 = lscov(A, b)
A =
    1.0000    0.2000    0.1000
    1.0000    0.5000    0.3000
    1.0000    0.6000    0.4000
    1.0000    0.8000    0.9000
    1.0000    1.0000    1.1000
    1.0000    1.1000    1.4000
b =
    0.1700
    0.2600
    0.2800
    0.2300
    0.2700
    0.3400
a1 =
    0.1203
    0.3284
   -0.1312
a2 =
    0.1203
    0.3284
   -0.1312
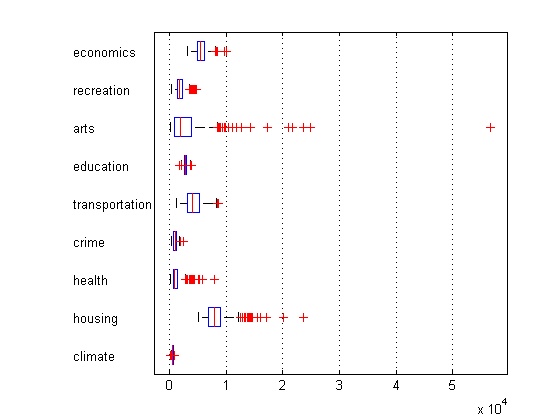
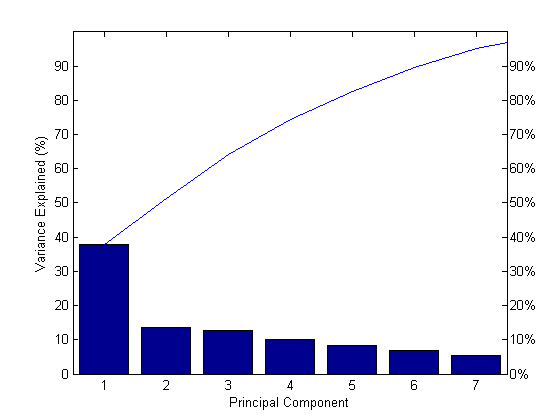
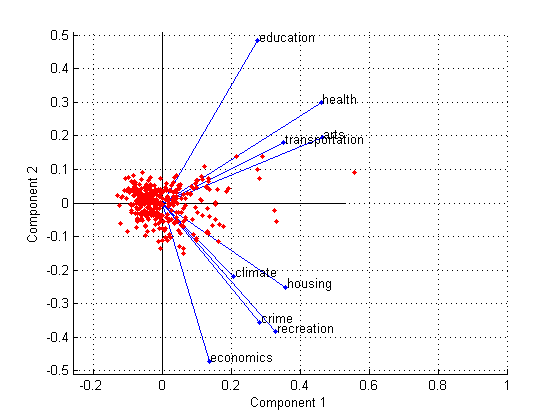
如何做主成分分析?
% 载入数据
load cities;

whos
%   Name             Size         Bytes  Class
%   categories    9x14          252  char array
%   names          329x43       28294  char array
%   ratings         329x9         23688  double array

% % ratings数据的box图
figure;
boxplot(ratings,'orientation','horizontal','labels',categories);
grid on;

% % 标准化预处理
stdr = std(ratings);
sr = ratings./repmat(stdr,329,1);
% % 使用princomp函数进行主成分分析
[coef,score,latent,t2] = princomp(sr);

% % 输出参数讲解

% coef:9*9矩阵
% 主成分系数:即原始数据线性组合生成主成分数据中每一维数据前面的系数.
% coef的每一列代表一个新生成的主成分的系数.
% 比如你想取出前三个主成分的系数, 如下可实现: pca3 = coef(:,1:3);

% score:329*9矩阵
% 字面理解:主成分得分
% 即原始数据在新生成的主成分空间里的坐标值.

% latent:9*1矩阵
% 一个列向量,由sr的协方差矩阵的特征值组成.
% 即 latent = sort(eig(cov(sr)),'descend');
% 测试如下:
% sort(eig(cov(sr)),'descend') =
%     3.4083
%     1.2140
%     1.1415
%     0.9209
%     0.7533
%     0.6306
%     0.4930
%     0.3180
%     0.1204
% latent =
%     3.4083
%     1.2140
%     1.1415
%     0.9209
%     0.7533
%     0.6306
%     0.4930
%     0.3180
%     0.1204

% t2:329*1
% 一中多元统计距离,记录的是每一个观察量到中心的距离

% % 如何提取主成分,达到降维的目的
% 通过latent,可以知道提取前几个主成分就可以了.
figure;
percent_explained = 100*latent/sum(latent);
pareto(percent_explained);
xlabel('Principal Component');
ylabel('Variance Explained (%)');

% 图中的线表示的累积变量解释程度.
% 通过看图可以看出前七个主成分可以表示出原始数据的90%.
% 所以在90%的意义下只需提取前七个主成分即可,进而达到主成分提取的目的.

% % 结果的可视化
figure;
biplot(coef(:,1:2), 'scores',score(:,1:2),...
'varlabels',categories);
axis([-.26 1 -.51 .51]);
% 横坐标和纵坐标分别表示第一主成分和第二主成分
% 红色的点代表329个观察量,其坐标就是score
% 蓝色的向量的方向和长度表示了每个原始变量对新的主成分的贡献,其坐标就是coef.
  Name                   Size              Bytes  Class      Attributes

  A                      6x3                 144  double
  AX                     1x2                  16  double
  A_max                  1x1                   8  double
  A_min                  1x1                   8  double
  A_unique               1x6                  48  double
  B                      5x5                 200  double
  C                      1x1                   8  double
  Data_Num               1x1                   8  double
  H1                     1x1                   8  double
  H2                     1x1                   8  double
  I                      1x3                  24  double
  Ind_col                1x4                  32  double
  Ind_row                1x3                  24  double
  J                      1x1                   8  double
  M                      1x3                  24  double
  Mean_Value             1x1                   8  double
  N                      1x1                   8  double
  RGB                    1x3                  24  double
  STD_Value              1x1                   8  double
  X                      6x6                 288  double
  Y_col                  1x3                  24  double
  Y_row                  1x4                  32  double
  Z                      1x1                  16  double     complex
  ZC                     1x1                  16  double     complex
  Z_abs                  1x1                   8  double
  Z_angle                1x1                   8  double
  Z_imag                 1x1                   8  double
  Z_real                 1x1                   8  double
  Ztemp                  1x7                  56  double
  a                      1x1                   8  double
  a1                     3x1                  24  double
  a2                     3x1                  24  double
  a_colmean              1x4                  32  double
  a_rowmean              4x1                  32  double
  ans                    3x3                  72  double
  b                      6x1                  48  double
  bottom                 1x1                   8  double
  c                      1x1                   8  double
  categories             9x14                252  char
  comb                   6x2                  96  double
  combnum                1x1                   8  double
  cwd                    1x91                182  char
  d                      1x11                 22  char
  d1                     1x10                 20  char
  d2                     1x10                 20  char
  d3                     1x10                 20  char
  dis                  782x5               39036  fints
  dis_CLOSE            782x1                6256  double
  dis_HIGH             782x1                6256  double
  dis_LOW              782x1                6256  double
  dis_OPEN             782x1                6256  double
  dis_VOLUME           782x1                6256  double
  dis_nv               782x4               32722  fints
  dy_dx                  1x1                  60  sym
  explode                1x5                  40  double
  fac                    1x1                   8  double
  headers                1x3                 212  cell
  height                 1x1                   8  double
  income                 1x4                  32  double
  left                   1x1                   8  double
  m                      1x1                   8  double
  mean_x                 1x1                   8  double
  n                      1x1                   8  double
  n1                     1x1                   8  double
  n2                     1x1                   8  double
  n3                     1x1                   8  double
  names                329x43              28294  char
  out                    5x5                 200  double
  outgo                  1x4                  32  double
  q_dis                 13x4                1974  fints
  r                      1x1                   8  double
  ratings              329x9               23688  double
  s1                     2x1                  60  sym
  s2                     2x1                  60  sym
  s3                     4x1                  60  sym
  std_x                  1x1                   8  double
  str                    2x1                 162  cell
  string                 1x3                   6  char
  strlen                 1x1                   8  double
  substr1                1x2                   4  char
  substr2                1x3                   6  char
  t                      1x629              5032  double
  tl                     4x4                 128  double
  tu                     4x4                 128  double
  values                 3x3                 606  cell
  whetherAequalsB        1x1                   1  logical
  width                  1x1                   8  double
  x                      1x629              5032  double
  x1                     6x1                  48  double
  x2                     6x1                  48  double
  x_dataset            100x1                1784  dataset
  x_diag                 5x1                  40  double
  y                      1x629              5032  double
  y1                     1x2001            16008  double
  y2                     1x2001            16008  double
  z                      1x63                504  double
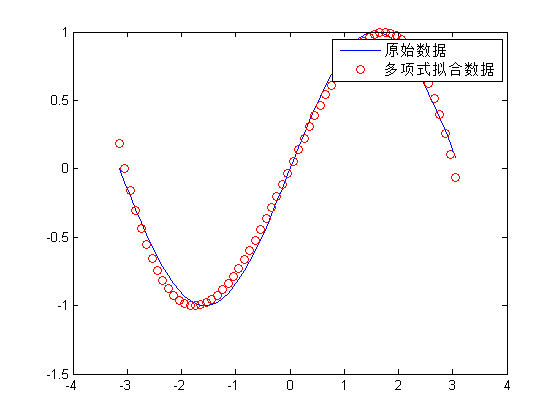
多项式回归应该用什么函数?
x = (-pi: 0.1: pi)';
y = sin(x);

p = polyfit(x,y,3)

f = polyval(p,x);

figure;
plot(x,y,'-', x,f,'ro');
legend('原始数据', '多项式拟合数据');
p =
   -0.0931   -0.0020    0.8557    0.0041
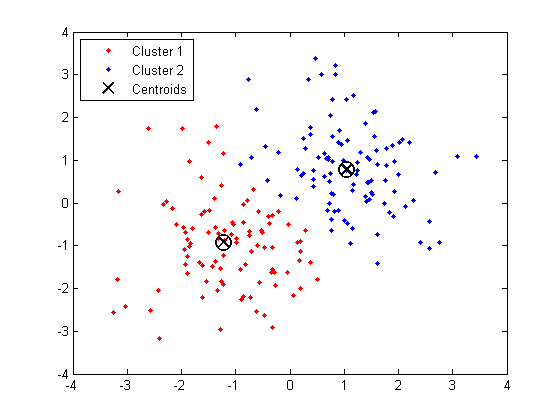
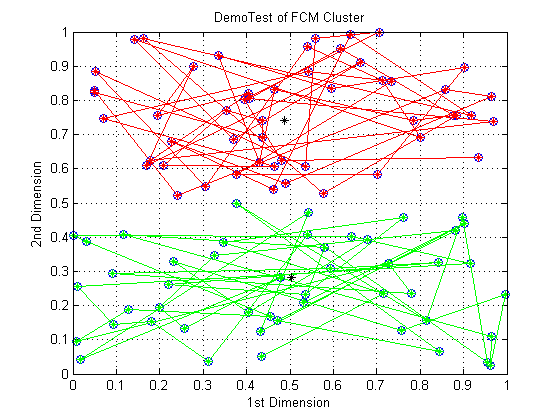
如何做聚类分析?
% kmeans
figure;
X = [randn(100,2)+ones(100,2);...
     randn(100,2)-ones(100,2)];
opts = statset('Display','final');

[idx,ctrs] = kmeans(X,2,...
                    'Distance','city',...
                    'Replicates',5,...
                    'Options',opts);

plot(X(idx==1,1),X(idx==1,2),'r.','MarkerSize',12)
hold on
plot(X(idx==2,1),X(idx==2,2),'b.','MarkerSize',12)
plot(ctrs(:,1),ctrs(:,2),'kx',...
     'MarkerSize',12,'LineWidth',2)
plot(ctrs(:,1),ctrs(:,2),'ko',...
     'MarkerSize',12,'LineWidth',2)
legend('Cluster 1','Cluster 2','Centroids',...
       'Location','NW')

% FCM
data = rand(100,2);
options = [2;100;1e-5;1];
[center,U,obj_fcn] = fcm(data,2,options);
figure;
plot(data(:,1), data(:,2),'o');
title('DemoTest of FCM Cluster');
xlabel('1st Dimension');
ylabel('2nd Dimension');
grid on;
hold on;
maxU = max(U);
index1 = find(U(1,:) == maxU);
index2 = find(U(2,:) == maxU);
line(data(index1,1),data(index1,2),'marker','*','color','g');
line(data(index2,1),data(index2,2),'marker','*','color','r');
plot([center([1 2],1)],[center([1 2],2)],'*','color','k')
hold off;
4 iterations, total sum of distances = 286.494.
4 iterations, total sum of distances = 286.494.
6 iterations, total sum of distances = 286.494.
5 iterations, total sum of distances = 286.494.
5 iterations, total sum of distances = 286.494.
Iteration count = 1, obj. fcn = 9.852617
Iteration count = 2, obj. fcn = 8.219597
Iteration count = 3, obj. fcn = 8.216619
Iteration count = 4, obj. fcn = 8.205398
Iteration count = 5, obj. fcn = 8.165428
Iteration count = 6, obj. fcn = 8.047099
Iteration count = 7, obj. fcn = 7.809399
Iteration count = 8, obj. fcn = 7.555721
Iteration count = 9, obj. fcn = 7.428529
Iteration count = 10, obj. fcn = 7.390721
Iteration count = 11, obj. fcn = 7.376852
Iteration count = 12, obj. fcn = 7.366987
Iteration count = 13, obj. fcn = 7.357756
Iteration count = 14, obj. fcn = 7.348738
Iteration count = 15, obj. fcn = 7.339933
Iteration count = 16, obj. fcn = 7.331397
Iteration count = 17, obj. fcn = 7.323188
Iteration count = 18, obj. fcn = 7.315355
Iteration count = 19, obj. fcn = 7.307937
Iteration count = 20, obj. fcn = 7.300961
Iteration count = 21, obj. fcn = 7.294444
Iteration count = 22, obj. fcn = 7.288392
Iteration count = 23, obj. fcn = 7.282803
Iteration count = 24, obj. fcn = 7.277671
Iteration count = 25, obj. fcn = 7.272978
Iteration count = 26, obj. fcn = 7.268708
Iteration count = 27, obj. fcn = 7.264838
Iteration count = 28, obj. fcn = 7.261343
Iteration count = 29, obj. fcn = 7.258197
Iteration count = 30, obj. fcn = 7.255375
Iteration count = 31, obj. fcn = 7.252851
Iteration count = 32, obj. fcn = 7.250598
Iteration count = 33, obj. fcn = 7.248592
Iteration count = 34, obj. fcn = 7.246811
Iteration count = 35, obj. fcn = 7.245231
Iteration count = 36, obj. fcn = 7.243832
Iteration count = 37, obj. fcn = 7.242596
Iteration count = 38, obj. fcn = 7.241505
Iteration count = 39, obj. fcn = 7.240544
Iteration count = 40, obj. fcn = 7.239697
Iteration count = 41, obj. fcn = 7.238953
Iteration count = 42, obj. fcn = 7.238298
Iteration count = 43, obj. fcn = 7.237724
Iteration count = 44, obj. fcn = 7.237220
Iteration count = 45, obj. fcn = 7.236778
Iteration count = 46, obj. fcn = 7.236391
Iteration count = 47, obj. fcn = 7.236052
Iteration count = 48, obj. fcn = 7.235755
Iteration count = 49, obj. fcn = 7.235496
Iteration count = 50, obj. fcn = 7.235269
Iteration count = 51, obj. fcn = 7.235070
Iteration count = 52, obj. fcn = 7.234897
Iteration count = 53, obj. fcn = 7.234745
Iteration count = 54, obj. fcn = 7.234613
Iteration count = 55, obj. fcn = 7.234498
Iteration count = 56, obj. fcn = 7.234397
Iteration count = 57, obj. fcn = 7.234309
Iteration count = 58, obj. fcn = 7.234232
Iteration count = 59, obj. fcn = 7.234165
Iteration count = 60, obj. fcn = 7.234106
Iteration count = 61, obj. fcn = 7.234055
Iteration count = 62, obj. fcn = 7.234011
Iteration count = 63, obj. fcn = 7.233972
Iteration count = 64, obj. fcn = 7.233938
Iteration count = 65, obj. fcn = 7.233909
Iteration count = 66, obj. fcn = 7.233883
Iteration count = 67, obj. fcn = 7.233861
Iteration count = 68, obj. fcn = 7.233841
Iteration count = 69, obj. fcn = 7.233824
Iteration count = 70, obj. fcn = 7.233809
Iteration count = 71, obj. fcn = 7.233796
Iteration count = 72, obj. fcn = 7.233785
Iteration count = 73, obj. fcn = 7.233775
如何利用MATLAB获取免费的金融数据?
conn = yahoo;
test = fetch(conn,{'600409.SS'},{'Close'},'08/01/13','08/08/13','d');

d = fints(test(:,1), test(:,2), 'Close', 'D', '600409.SS_Close')

close(yahoo)
d =

    desc:  600409.SS_Close
    freq:  Daily (1)

    'dates:  (6)'    'Close:  (6)'
    '01-Aug-2013'    [     4.2100]
    '02-Aug-2013'    [     4.2100]
    '05-Aug-2013'    [     4.3200]
    '06-Aug-2013'    [     4.3900]
    '07-Aug-2013'    [     4.3500]
    '08-Aug-2013'    [     4.3600]
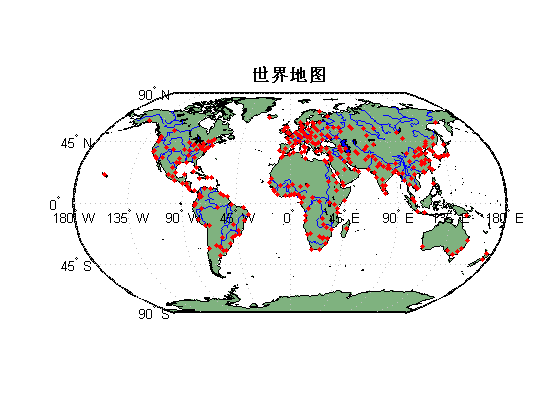
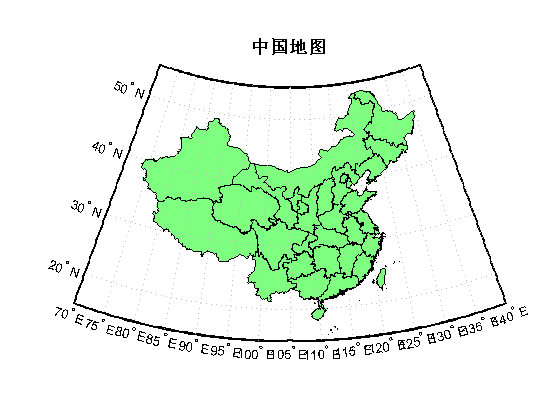
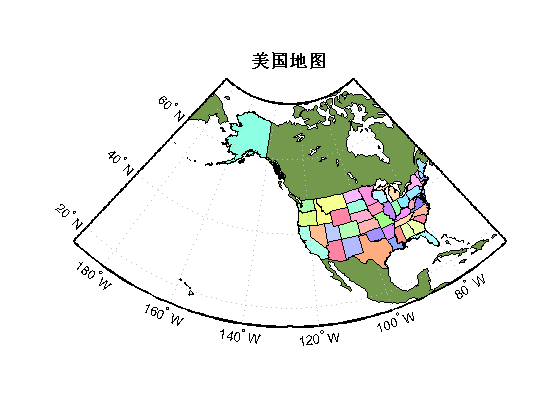
在MATLAB中如何处理地图数据?
% 世界地图
figure;
ax = worldmap('World');
% setm(ax, 'Origin', [0 180 0])
land = shaperead('landareas', 'UseGeoCoords', true);
geoshow(ax, land, 'FaceColor', [0.5 0.7 0.5])
lakes = shaperead('worldlakes', 'UseGeoCoords', true);
geoshow(lakes, 'FaceColor', 'blue')
rivers = shaperead('worldrivers', 'UseGeoCoords', true);
geoshow(rivers, 'Color', 'blue')
cities = shaperead('worldcities', 'UseGeoCoords', true);
geoshow(cities, 'Marker', '.', 'Color', 'red')
title('世界地图','FontSize',14,'FontWeight','Bold');

% 中国地图
figure;
worldmap([15 55],[70 140])%纬度经度范围显示
%显示矢量数据
sh1 = shaperead('bou2_4p', 'UseGeoCoords', true);
geoshow(sh1, 'FaceColor', [0.5 1.0 0.5]);

setm(gca,'MLineLocation',5)%设置经度间隔为5
setm(gca,'PLineLocation',10)%设置经度间隔为10
setm(gca,'MLabelLocation',5)%设置经度标签为每隔5度
setm(gca,'PLabelLocation',10)%设置纬度标签为每隔10度
title('中国地图','FontSize',14,'FontWeight','Bold');

% 美国地图
figure;
ax = worldmap('USA');
load coast
geoshow(ax, lat, long,...
'DisplayType', 'polygon', 'FaceColor', [.45 .60 .30])
states = shaperead('usastatelo', 'UseGeoCoords', true);
faceColors = makesymbolspec('Polygon',...
    {'INDEX', [1 numel(states)], 'FaceColor', ...
    polcmap(numel(states))}); % NOTE - colors are random
geoshow(ax, states, 'DisplayType', 'polygon', ...
  'SymbolSpec', faceColors)
title('美国地图','FontSize',14,'FontWeight','Bold');
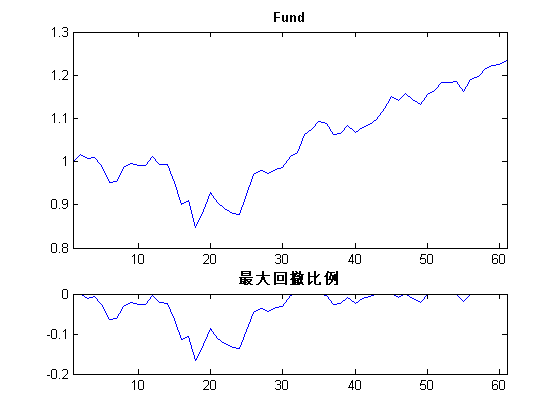
如何计算一个资金流的最大回撤?
load FundMarketCash
fund = TestData(:,1);

[DrawDownPercent,DrawDownAbs] = RetraceRatio(fund);

figure;
subplot(3,1,1:2);
plot(fund);
xlim([1 length(fund)]);
title('Fund', 'FontWeight', 'Bold');

subplot(313);
plot( DrawDownPercent );
xlim([1 length(fund)]);
title('最大回撤比例', 'FontWeight', 'Bold');
Test
Record Time
toc;
Elapsed time is 117.730494 seconds.